Showing 1–16 of 69 results
Agency
27 items
Appraisal Management Companies
4 items
Bank
17 items
Bank Statement
1 items
Broker
4 items
Construction
1 items
Content
4 items
Correspondents
12 items
Credit Union
9 items
Fannie Mae
4 items
FHA
2 items
Freddie Mac
3 items
Ginnie Mae
11 items
GSE
15 items
HELOC
10 items
Home Equity
15 items
Housing Finance
17 items
Institution Type
41 items
Jumbo
5 items
Loan Credit Type
1 items
Loan Purpose
7 items
Loan Status
2 items
Loan Type
2 items
LOS
1 items
MBA
1 items
Non QM
2 items
Non-bank
8 items
Originators
53 items
Production Channel
10 items
Property Valuation
11 items
Repurchase
1 items
Research
2 items
Retail
5 items
Reverse/HECM
2 items
Servicers
2 items
VA
2 items
Vendors
4 items
-
 ×
×
Top Originators Property Valuations Market Share Report – Full Year 2025
$8,750.00
Open full product pageTop Originators Property Valuations Market Share Report for Full Year of 2025, showing Loan Count and Market Share (%) by Individual Lender, Loan Type (Conventional, Government & Home Equity) and Property Valuation. Allows users to identify lenders directly originating loans for the most recent quarter, and the property valuations being used. Excludes Correspondent/Purchased loans.
-
 ×
×
Top Originators Property Valuations Market Share Report – Q4 2025
$2,750.00
Open full product pageTop Originators Property Valuations Market Share Report for Q4 2025, showing Loan Count and Market Share (%) by Individual Lender, Loan Type (Conventional, Government & Home Equity) and Property Valuation. Allows users to identify lenders directly originating loans for the most recent quarter, and the property valuations being used. Excludes Correspondent/Purchased loans.
-
 ×
×
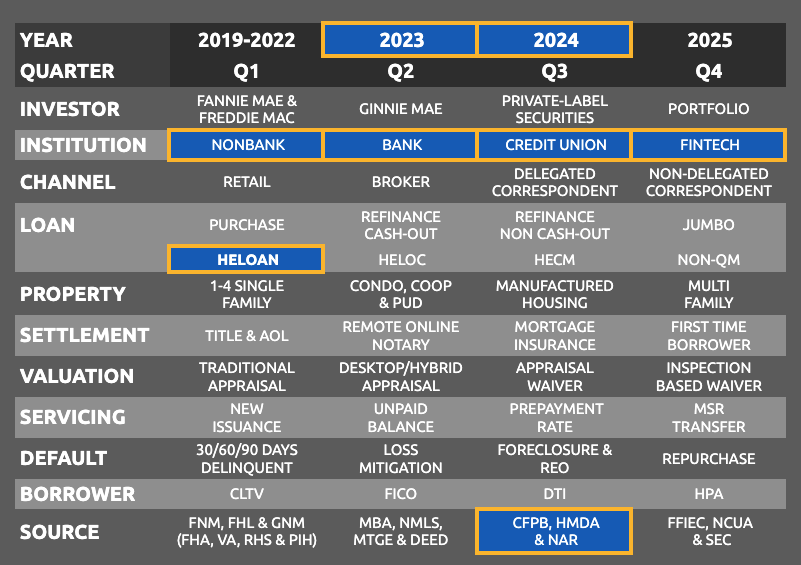
HELOAN Applications and Loans – 2023 and 2024
$750.00
Open full product pageAll Financial Institutions reporting HELOAN applications and loans in 2023 and 2024, including 3,890+ Banks, Credit Unions and Non-banks with Address, City, State, Zip, Website and Phone Number. Provides data by Institution Type and by Institution, including Number and Value of HELOAN Applications and Fundings. Plus Number and Value of HELOAN Applications Declined, with % Denied for Low Credit Score, % Denied for High LTV Ratio, % Denied for High DTI and % Denied for Employment Issues
-
 ×
×
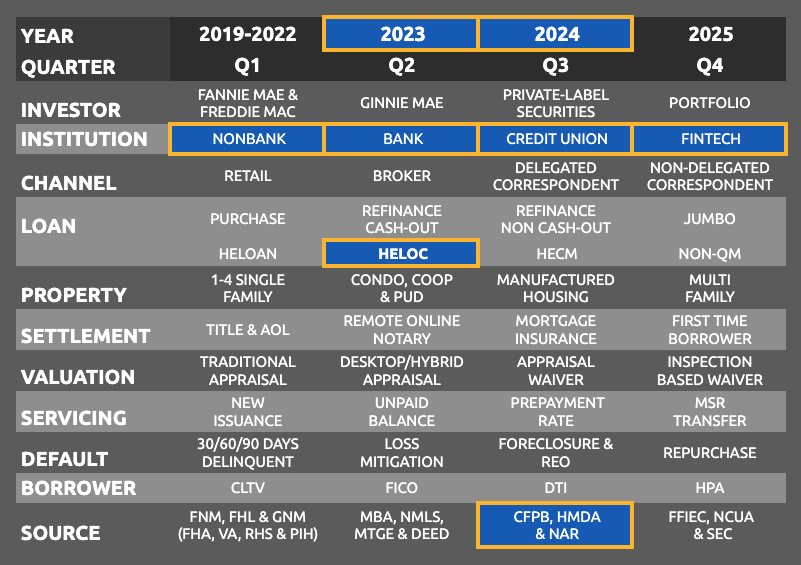
HELOC Applications and Loans – 2023 and 2024
$750.00
Open full product pageAll Financial Institutions reporting HELOC applications and loans in 2023 and 2024, including 1,200+ Banks, Credit Unions and Non-banks with Address, City, State, Zip, Website and Phone Number. Provides data by Institution Type and by Institution, including Number and Value of HELOC Applications and Fundings. Plus Number and Value of HELOC Applications Declined, with % Denied for Low Credit Score, % Denied for High LTV Ratio, % Denied for High DTI and % Denied for Employment Issues
-
 ×
×
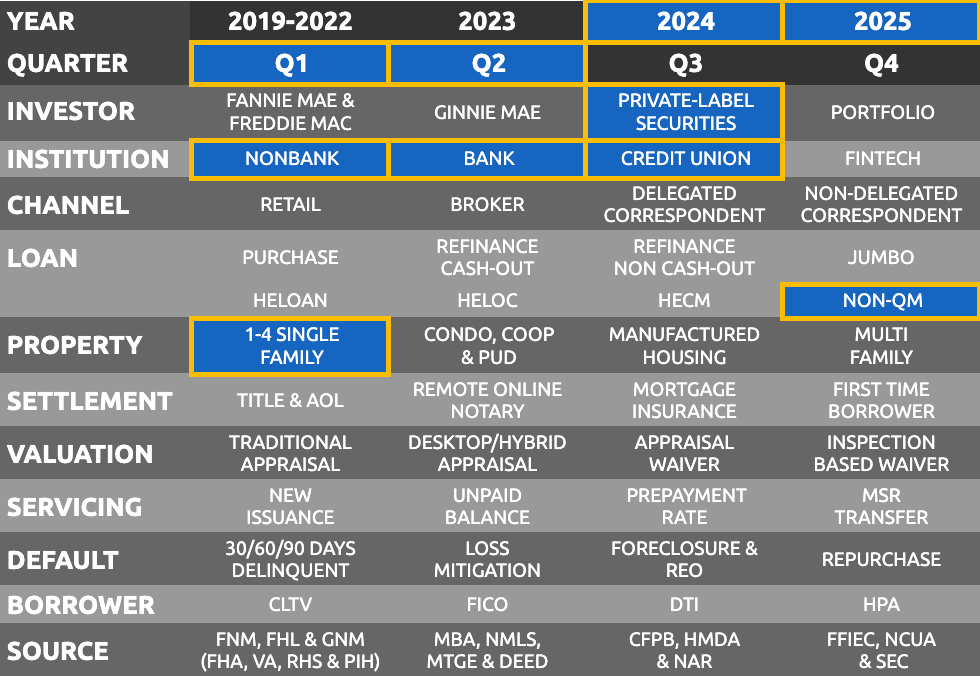
Top Originators Property Valuations Market Share Report – Q3 2025
$2,750.00
Open full product pageTop Originators Property Valuations Market Share Report for Q3 2025, showing Loan Count and Market Share (%) by Individual Lender, Loan Type (Conventional, Government & Home Equity) and Property Valuation. Allows users to identify lenders directly originating loans for the most recent quarter, and the property valuations being used. Excludes Correspondent/Purchased loans.
-
 ×
×
ICE Mortgage Technology Encompass LOS Customer Organizations
$3,750.00
Open full product pageList of 5,800 organizations with ICE Mortgage Technology Encompass LOS and associated products, including: Company Name, Address, City, State, Zip and Country, and Website URL
-
 ×
×
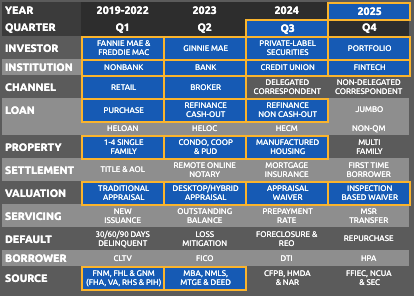
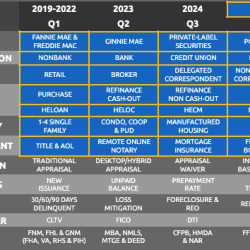
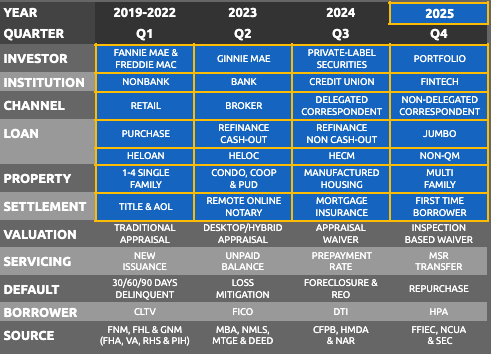
U.S. Residential Real Estate Automated Valuation Models (AVMs) – Market Report (2015-2030)
$2,950.00
Open full product pageGroundbreaking new 70-page report on the U.S. residential AVM market, defining the size of the U.S. single family & multifamily housing market, mortgage activity & total debt, and total addressable market estimates for AVMs by segment, unit volume & revenues.
-
 ×
×
Top Active Commercial Real Estate (CRE) Appraisal Firms & AMCs – October 2025
$425.00
Open full product pageTop Active Commercial Real Estate (CRE) Appraisal Firms & AMCs with Active Appraiser State Licenses, as-of October 2025. Shows +920 appraiser firms and 8 AMCs with Standardized Names, Industry Type, Organization Type, Number of Appraisers (Certified General, Certified Residential, Licensed Residential), Licensed State Codes, and Number of Licensed States. The deliverable is a multi-tab spreadsheet file.
-
 ×
×
Top Originators Property Valuations Market Share Report – Q2 2025
$2,750.00
Open full product pageTop Originators Property Valuations Market Share Report for Q2 2025, showing Loan Count and Market Share (%) by Individual Lender, Loan Type (Conventional, Government & Home Equity) and Property Valuation. Allows users to identify lenders directly originating loans for the most recent quarter, and the property valuations being used. Excludes Correspondent/Purchased loans.
-
 ×
×
Top Agency Servicers – August 2025
$1,750.00
Open full product pageShows all ~1,650 Agency Servicers in August 2025, including loan counts for Fannie Mae, Freddie Mac, FHA, VA, PIH and RHS loans, plus purchase and refinance. Each servicer has a unique ID, Standardized Servicer Name and Institution Type.
$1,750.00 -
 ×
×
Top Retail Originators – Quarterly Q2 2025
$3,750.00
Open full product pageTop Retail Originators in Q2 2025, showing Purchase and Refinance Loan Counts for Conventional, Government and Home Equity Lending. Allows users to understand which lenders are directly originating loans and lines-of-credit for the most recent quarter. Excludes brokered and correspondent purchased loans.
-
 ×
×
Top Bank Statement Originators – Quarterly From Q3 2024 To Q2 2025
$575.00
Open full product pageThe Top Bank Statement Originators, including 440 Unique Originators with Loans Issued Quarterly from Q3 2024 to Q2 2025.