Showing all 15 results
-
 ×
×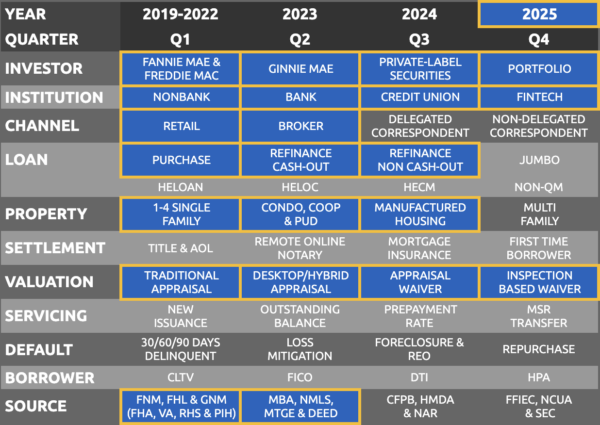
Top Originators Property Valuations Market Share Report – Full Year 2025
$8,750.00
Open full product pageTop Originators Property Valuations Market Share Report for Full Year of 2025, showing Loan Count and Market Share (%) by Individual Lender, Loan Type (Conventional, Government & Home Equity) and Property Valuation. Allows users to identify lenders directly originating loans for the most recent quarter, and the property valuations being used. Excludes Correspondent/Purchased loans.
-
 ×
×
Top Originators Property Valuations Market Share Report – Q4 2025
$2,750.00
Open full product pageTop Originators Property Valuations Market Share Report for Q4 2025, showing Loan Count and Market Share (%) by Individual Lender, Loan Type (Conventional, Government & Home Equity) and Property Valuation. Allows users to identify lenders directly originating loans for the most recent quarter, and the property valuations being used. Excludes Correspondent/Purchased loans.
-
 ×
×
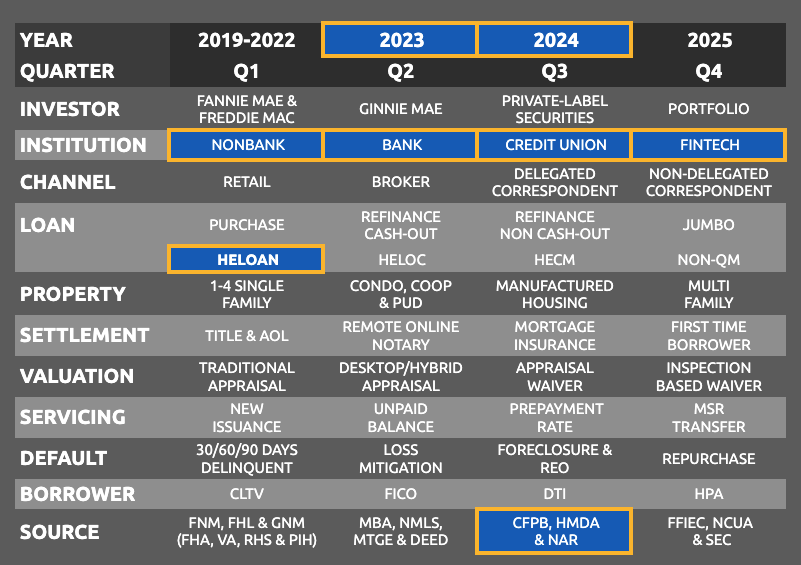
HELOAN Applications and Loans – 2023 and 2024
$750.00
Open full product pageAll Financial Institutions reporting HELOAN applications and loans in 2023 and 2024, including 3,890+ Banks, Credit Unions and Non-banks with Address, City, State, Zip, Website and Phone Number. Provides data by Institution Type and by Institution, including Number and Value of HELOAN Applications and Fundings. Plus Number and Value of HELOAN Applications Declined, with % Denied for Low Credit Score, % Denied for High LTV Ratio, % Denied for High DTI and % Denied for Employment Issues
-
 ×
×
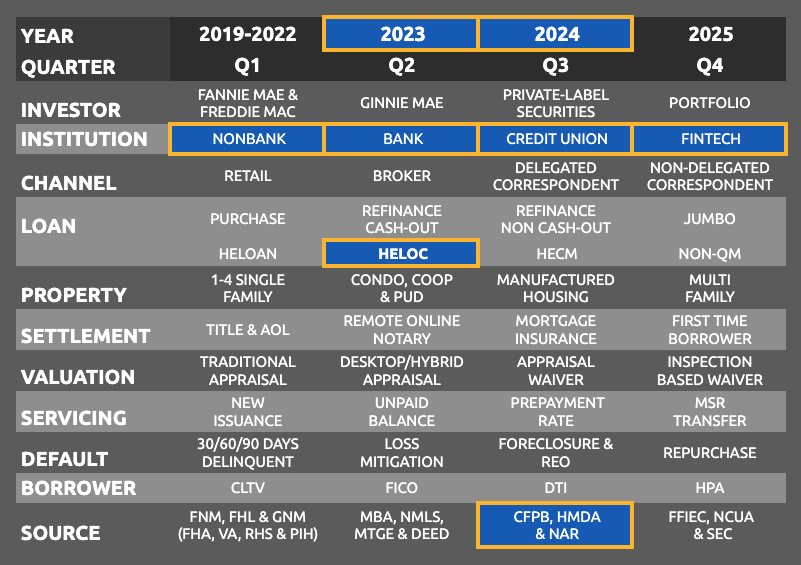
HELOC Applications and Loans – 2023 and 2024
$750.00
Open full product pageAll Financial Institutions reporting HELOC applications and loans in 2023 and 2024, including 1,200+ Banks, Credit Unions and Non-banks with Address, City, State, Zip, Website and Phone Number. Provides data by Institution Type and by Institution, including Number and Value of HELOC Applications and Fundings. Plus Number and Value of HELOC Applications Declined, with % Denied for Low Credit Score, % Denied for High LTV Ratio, % Denied for High DTI and % Denied for Employment Issues
-
 ×
×
Top Originators Property Valuations Market Share Report – Q3 2025
$2,750.00
Open full product pageTop Originators Property Valuations Market Share Report for Q3 2025, showing Loan Count and Market Share (%) by Individual Lender, Loan Type (Conventional, Government & Home Equity) and Property Valuation. Allows users to identify lenders directly originating loans for the most recent quarter, and the property valuations being used. Excludes Correspondent/Purchased loans.
-
 ×
×
U.S. Residential Real Estate Automated Valuation Models (AVMs) – Market Report (2015-2030)
$2,950.00
Open full product pageGroundbreaking new 70-page report on the U.S. residential AVM market, defining the size of the U.S. single family & multifamily housing market, mortgage activity & total debt, and total addressable market estimates for AVMs by segment, unit volume & revenues.
-
 ×
×
Top Originators Property Valuations Market Share Report – Q2 2025
$2,750.00
Open full product pageTop Originators Property Valuations Market Share Report for Q2 2025, showing Loan Count and Market Share (%) by Individual Lender, Loan Type (Conventional, Government & Home Equity) and Property Valuation. Allows users to identify lenders directly originating loans for the most recent quarter, and the property valuations being used. Excludes Correspondent/Purchased loans.
-
 ×
×
Top Retail Originators – Quarterly Q2 2025
$3,750.00
Open full product pageTop Retail Originators in Q2 2025, showing Purchase and Refinance Loan Counts for Conventional, Government and Home Equity Lending. Allows users to understand which lenders are directly originating loans and lines-of-credit for the most recent quarter. Excludes brokered and correspondent purchased loans.
-
 ×
×
Top California Community Banks in Q4 2024
$175.00
Open full product pageThe Top California Community Banks in Q4 2024, in an easy-to-use format for easy analysis. Includes all community banks with assets less than $10BN as reported in Q4 2024 – more than 300 institutions – showing lender name, website, and ranking by total assets, and 1st mortgages, 2nd mortgages and HELOCs held for investment in Q4 2024, and compared to the prior Q3 2024 quarter and same period Q4 2023 a year ago.
-
×
Top Texas Community Banks in Q4 2024
$175.00
Open full product pageThe Top Texas Community Banks in Q4 2024, in an easy-to-use format for easy analysis. Includes all community banks with assets less than $10BN as reported in Q4 2024 – more than 300 institutions – showing lender name, website, and ranking by total assets, and 1st mortgages, 2nd mortgages and HELOCs held for investment in Q4 2024, and compared to the prior Q3 2024 quarter and same period Q4 2023 a year ago.
-
×
Top Illinois Community Banks in Q4 2024
$175.00
Open full product pageThe Top Illinois Community Banks in Q4 2024, in an easy-to-use format for easy analysis. Includes all community banks with assets less than $10BN as reported in Q4 2024 – more than 300 institutions – showing lender name, website, and ranking by total assets, and 1st mortgages, 2nd mortgages and HELOCs held for investment in Q4 2024, and compared to the prior Q3 2024 quarter and same period Q4 2023 a year ago.
-
 ×
×
Top HELOC Originators in Q4 2024
$275.00
Open full product pageThe Top Home Equity Line of Credit (HELOC) Originations in 2024, in an easy-to-use format for analysis and loading into financial, sales and marketing systems. Includes all originators with over 50 HELOCs recorded in 2024 – more than 2,750 institutions – showing lender name, institution type and loan volume, by quarter.
$275.00