Showing all 15 results
-
 ×
×
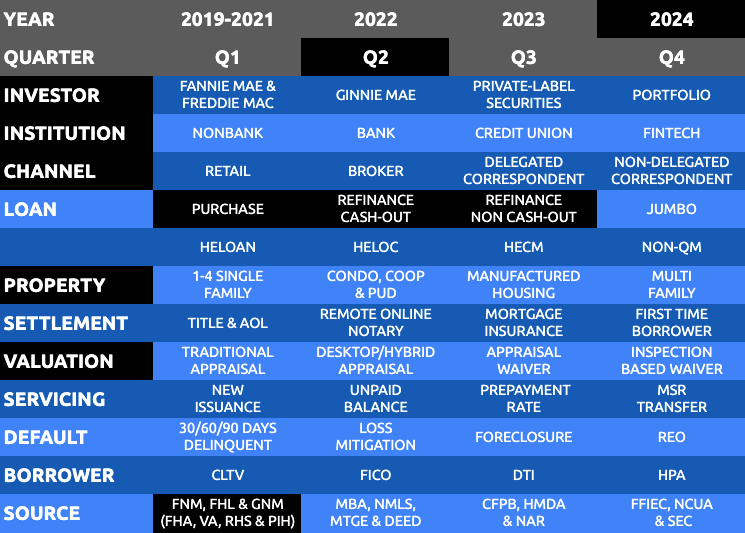
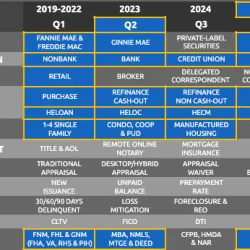
Top Originators Property Valuations Market Share Report – Full Year 2025
$8,750.00
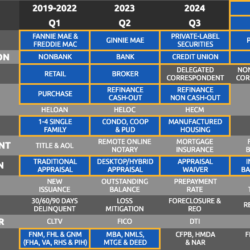
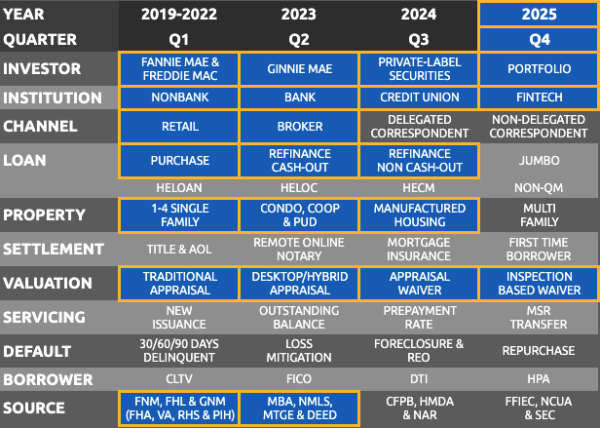
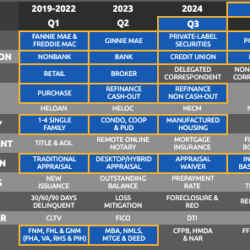
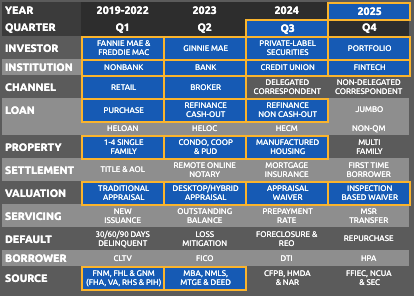
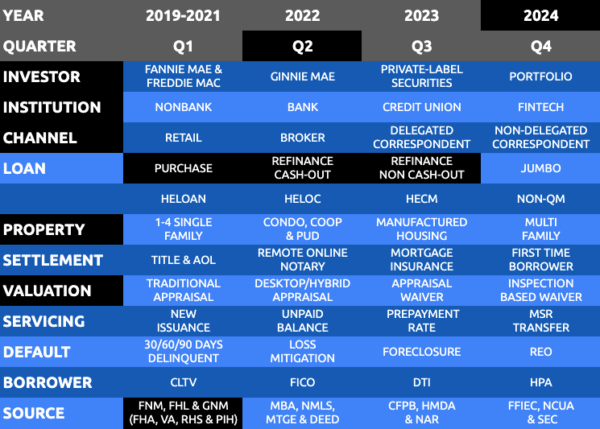
Open full product pageTop Originators Property Valuations Market Share Report for Full Year of 2025, showing Loan Count and Market Share (%) by Individual Lender, Loan Type (Conventional, Government & Home Equity) and Property Valuation. Allows users to identify lenders directly originating loans for the most recent quarter, and the property valuations being used. Excludes Correspondent/Purchased loans.
-
 ×
×
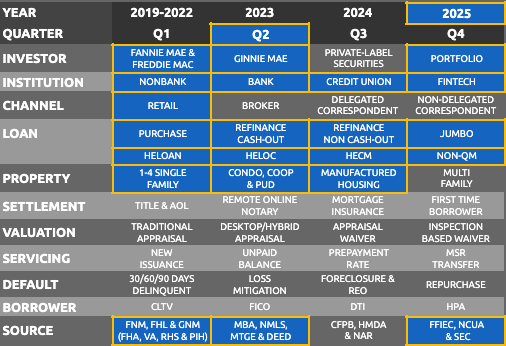
Top Originators Property Valuations Market Share Report – Q4 2025
$2,750.00
Open full product pageTop Originators Property Valuations Market Share Report for Q4 2025, showing Loan Count and Market Share (%) by Individual Lender, Loan Type (Conventional, Government & Home Equity) and Property Valuation. Allows users to identify lenders directly originating loans for the most recent quarter, and the property valuations being used. Excludes Correspondent/Purchased loans.
-
 ×
×
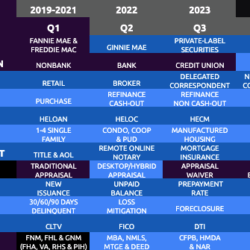
Top Originators Property Valuations Market Share Report – Q3 2025
$2,750.00
Open full product pageTop Originators Property Valuations Market Share Report for Q3 2025, showing Loan Count and Market Share (%) by Individual Lender, Loan Type (Conventional, Government & Home Equity) and Property Valuation. Allows users to identify lenders directly originating loans for the most recent quarter, and the property valuations being used. Excludes Correspondent/Purchased loans.
-
 ×
×
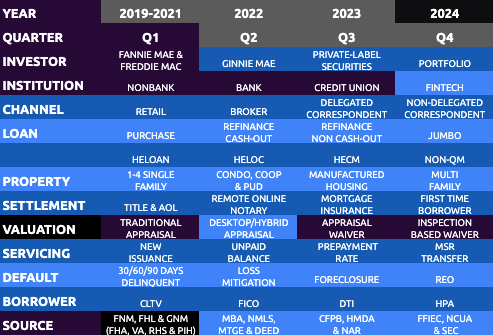
Top Originators Property Valuations Market Share Report – Q2 2025
$2,750.00
Open full product pageTop Originators Property Valuations Market Share Report for Q2 2025, showing Loan Count and Market Share (%) by Individual Lender, Loan Type (Conventional, Government & Home Equity) and Property Valuation. Allows users to identify lenders directly originating loans for the most recent quarter, and the property valuations being used. Excludes Correspondent/Purchased loans.
-
 ×
×
Top Agency Servicers – August 2025
$1,750.00
Open full product pageShows all ~1,650 Agency Servicers in August 2025, including loan counts for Fannie Mae, Freddie Mac, FHA, VA, PIH and RHS loans, plus purchase and refinance. Each servicer has a unique ID, Standardized Servicer Name and Institution Type.
$1,750.00 -
 ×
×
Top Retail Originators – Quarterly Q2 2025
$3,750.00
Open full product pageTop Retail Originators in Q2 2025, showing Purchase and Refinance Loan Counts for Conventional, Government and Home Equity Lending. Allows users to understand which lenders are directly originating loans and lines-of-credit for the most recent quarter. Excludes brokered and correspondent purchased loans.
-
 ×
×
GSE Repurchased Loans By State, By Month for 2024
$275.00
Open full product pageGSE Repurchases by Agency, State and Issuance Month for 2024, showing Loan Count, Current Balance, Original Balance and WAGC.
-
 ×
×
GSE Appraisal Modernization Lenders – 2017 to Q1 2025
Original price was: $450.00.$375.00Current price is: $375.00.
Open full product pageThis report identifies lenders utilizing GSE appraisal modernization solutions from 2017 through Q1 2025. This allows users to assess which lenders have already utilized inspection-based appraisal waivers, and are able to take advantage of hybrid appraisals immediately, and lists 585 GSE direct sellers and 2070 GSE correspondents.
Original price was: $450.00.$375.00Current price is: $375.00. -
 ×
×
Top Mortgage Correspondents using Appraisals & Inspection Based Waivers
Original price was: $350.00.$250.00Current price is: $250.00.
Open full product pageThe Top Mortgage Correspondents using Appraisals and Inspection Based Waivers in Q1 2024, by institution type, total loan and property valuation counts and with the number of appraisals, appraisal waivers and inspection-based waivers. Over 2,985 correspondent sellers, with 2,767 ordering over 37,500 appraisals, plus inspection based waivers.
Includes the Top Correspondent Aggregators for Q1 2024, showing their correspondent sellers by institution type, total loan and property valuation counts: UWM, Rocket Mtge, Mr Cooper, PennyMac, Amerihome, JP Morgan Chase, CMG Mtge, Citizens Bank, Cornerstone Mtge, Freedom Mtge, NewRez, Flagstar Bank (to be NewRez), PHH Mtge, Planet Home Lending and US Bank.
Original price was: $350.00.$250.00Current price is: $250.00. -
 ×
×
Top Mortgage Originators for Q2 2024 by Agency Property Valuations
Original price was: $1,750.00.$1,250.00Current price is: $1,250.00.
Open full product pageThe product provides top mortgage originators for Q2 2024 by loan volume, including institution type, agency, channel, loan purpose and property valuations (including appraisal, appraisal waiver and inspection-based waiver loan counts be lender), and is in an easy-to-use format for analysis and loading into financial, sales and marketing systems.
Original price was: $1,750.00.$1,250.00Current price is: $1,250.00. -
 ×
×
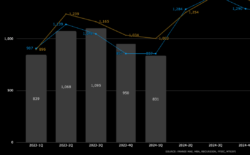
Housing Finance Forecast for April 2024
Original price was: $275.00.$0.00Current price is: $0.00.
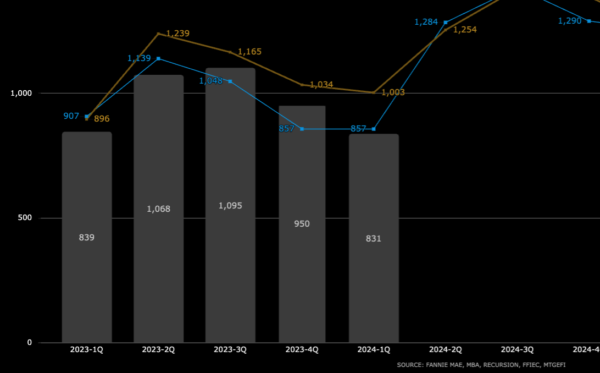
Open full product pageConsolidated housing finance forecasts for April 2024 of first-lien closed-end 1-4 single family mortgage originations and purchases for 2022-2025, for agency issuance and bank & credit union portfolios, updated March 2024. Includes 2022 and 2023 actuals, MtgeFi projections, reconciliation to HMDA 2022, and average loan amount from MBA.
Original price was: $275.00.$0.00Current price is: $0.00. -
 ×
×
Top Mortgage Correspondents with Property Valuations for Q4 2023
$1,750.00
Open full product pageThe product provides the top mortgage correspondent for Q4 2023 by institution type, total loan and property valuation counts. Additionally includes the top 25 correspondent aggregators for Q4 2023, showing all correspondents by institution type, total loan and property valuation counts. Property valuation shows the number of appraisals, appraisal waivers and inspection-based waivers.