Showing all 11 results
-
 ×
×
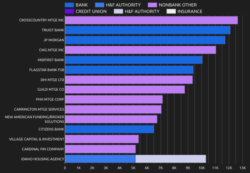
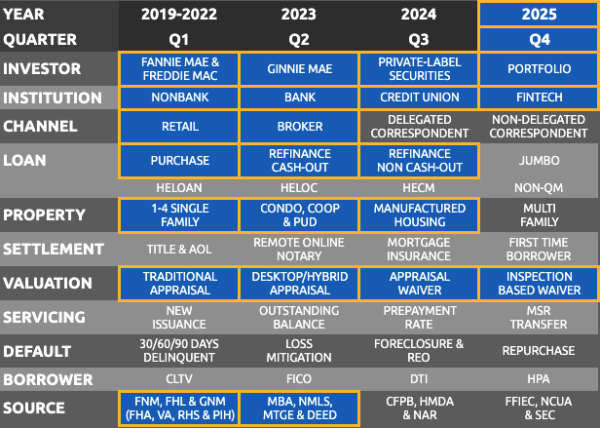
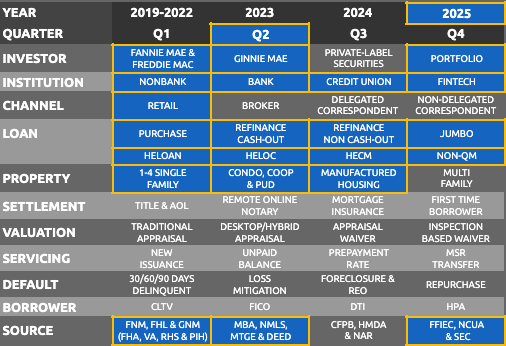
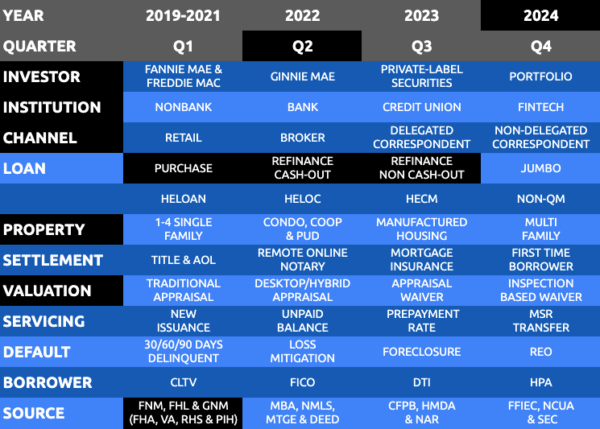
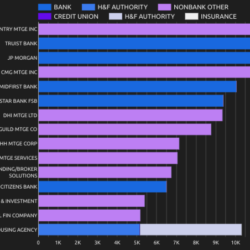
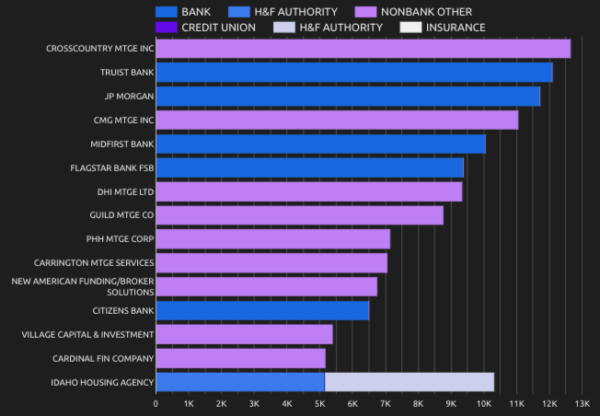
Top Originators Property Valuations Market Share Report – Full Year 2025
$8,750.00
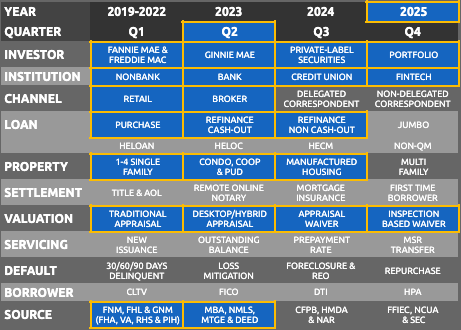
Open full product pageTop Originators Property Valuations Market Share Report for Full Year of 2025, showing Loan Count and Market Share (%) by Individual Lender, Loan Type (Conventional, Government & Home Equity) and Property Valuation. Allows users to identify lenders directly originating loans for the most recent quarter, and the property valuations being used. Excludes Correspondent/Purchased loans.
-
 ×
×
Top Originators Property Valuations Market Share Report – Q4 2025
$2,750.00
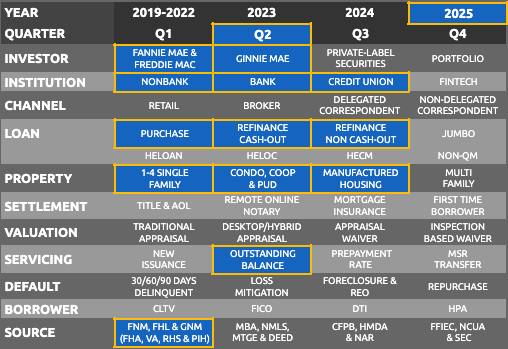
Open full product pageTop Originators Property Valuations Market Share Report for Q4 2025, showing Loan Count and Market Share (%) by Individual Lender, Loan Type (Conventional, Government & Home Equity) and Property Valuation. Allows users to identify lenders directly originating loans for the most recent quarter, and the property valuations being used. Excludes Correspondent/Purchased loans.
-
 ×
×
Top Originators Property Valuations Market Share Report – Q3 2025
$2,750.00
Open full product pageTop Originators Property Valuations Market Share Report for Q3 2025, showing Loan Count and Market Share (%) by Individual Lender, Loan Type (Conventional, Government & Home Equity) and Property Valuation. Allows users to identify lenders directly originating loans for the most recent quarter, and the property valuations being used. Excludes Correspondent/Purchased loans.
-
 ×
×
Top Originators Property Valuations Market Share Report – Q2 2025
$2,750.00
Open full product pageTop Originators Property Valuations Market Share Report for Q2 2025, showing Loan Count and Market Share (%) by Individual Lender, Loan Type (Conventional, Government & Home Equity) and Property Valuation. Allows users to identify lenders directly originating loans for the most recent quarter, and the property valuations being used. Excludes Correspondent/Purchased loans.
-
 ×
×
Top Agency Servicers – August 2025
$1,750.00
Open full product pageShows all ~1,650 Agency Servicers in August 2025, including loan counts for Fannie Mae, Freddie Mac, FHA, VA, PIH and RHS loans, plus purchase and refinance. Each servicer has a unique ID, Standardized Servicer Name and Institution Type.
$1,750.00 -
 ×
×
Top Retail Originators – Quarterly Q2 2025
$3,750.00
Open full product pageTop Retail Originators in Q2 2025, showing Purchase and Refinance Loan Counts for Conventional, Government and Home Equity Lending. Allows users to understand which lenders are directly originating loans and lines-of-credit for the most recent quarter. Excludes brokered and correspondent purchased loans.
-
 ×
×
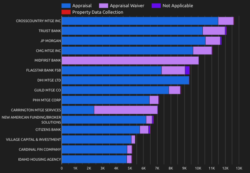
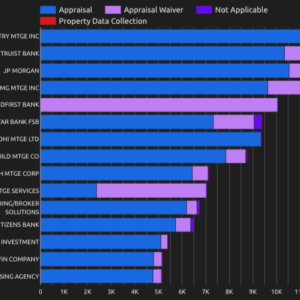
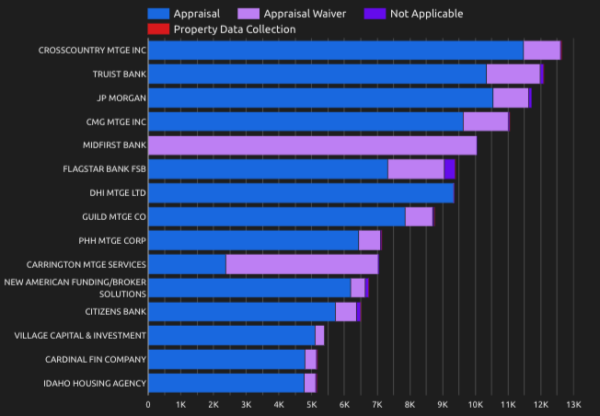
Top Mortgage Originators for Q2 2024 by Agency Property Valuations
Original price was: $1,750.00.$1,250.00Current price is: $1,250.00.
Open full product pageThe product provides top mortgage originators for Q2 2024 by loan volume, including institution type, agency, channel, loan purpose and property valuations (including appraisal, appraisal waiver and inspection-based waiver loan counts be lender), and is in an easy-to-use format for analysis and loading into financial, sales and marketing systems.
Original price was: $1,750.00.$1,250.00Current price is: $1,250.00. -
 ×
×
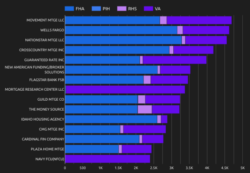
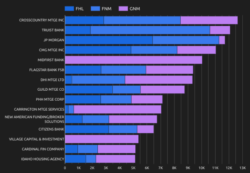
Top Mortgage Originators by Agency Property Valuations for Q1 2024
$1,750.00
Open full product pageThe product provides top agency mortgage originators for Q1 2024 by loan volume, including institution type, agency, channel, loan purpose and property valuations (including appraisal, appraisal waiver and inspection-based waiver loan counts be lender), and is in an easy-to-use format for analysis and loading into financial, sales and marketing systems.
-
 ×
×
Top Mortgage Originators by Ginnie Mae for Q4 2023
$750.00
Open full product pageThe product provides top mortgage originators by agency loan volume, including institution type and Ginnie Mae agency, and is in an easy-to-use format for analysis and loading into financial and customer relationship management (CRM) systems.
-
 ×
×
Top Mortgage Originators by Agency for Q4 2023
$750.00
Open full product pageThe product provides top agency mortgage originators by loan volume, including institution type and agency, and is in an easy-to-use format for analysis and loading into financial and customer relationship management (CRM) systems.
-
 ×
×
Top Mortgage Originators by Key Loan Attributes for Q4 2023
$1,750.00
Open full product pageThe product provides top agency mortgage originators by loan volume and original loan amount, including institution type, agency, channel, and loan purpose, and is in an easy-to-use format for analysis and loading into financial and customer relationship management (CRM) systems.