
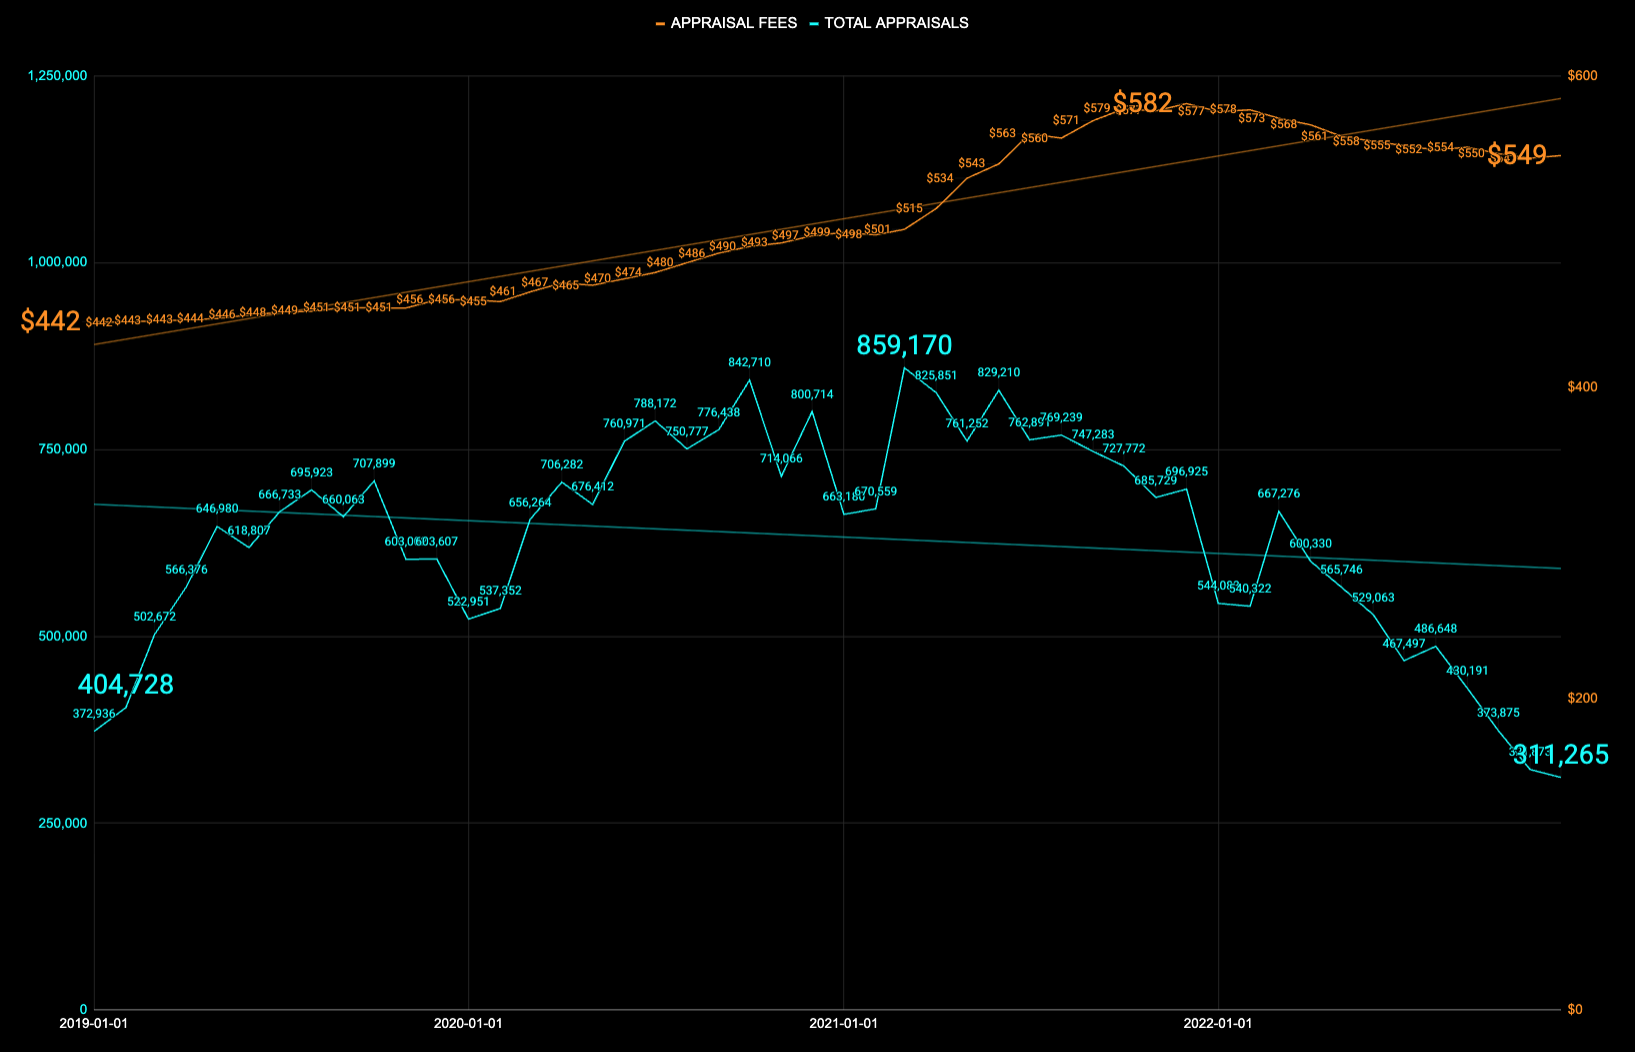
The article analyzes the behavior of appraisal fees during the COVID-19 pandemic refinance boom alongside total appraisal volume, appraisal turn time, and appraiser utilization rates.
Appraisal Fees Increases
During the 2020–2021 refinance boom, the national average appraisal fees increased by 31.6% from $442 to $582. In this same period appraisal volumes grew 101% from 427,000 to 860,000, and appraisal turn times grew 80% from 7.4 to 13.5 days.
Similarly, the number of unique appraisers grew 9.5% from Q1 2019 to the height of appraisal volumes in 2021, presumably as certified and licensed appraisers renewed inactive licenses.
The table below compares average monthly market conditions during Q1 2019 against peak monthly levels reached during 2021.
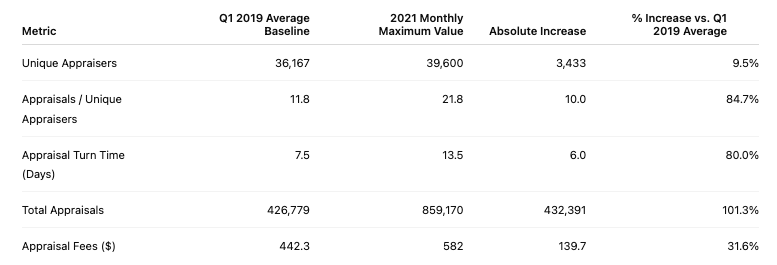
With limited appraiser capacity increases, the industry absorbed most of the additional demand through substantially higher appraiser utilization. The average number of appraisals completed by a unique appraiser monthly increased 84.7% from 11.8 to 21.8.
Appraiser Fees and Capacity Since 2021
Lenders, appraisal management companies, borrowers, and secondary market participants all experienced the higher appraisal fees due to capacity constraints during periods of higher mortgage origination activity.
Since 2021 the number of active residential appraisers has declined by 26%, from 39,600 to 29,400 as-of March 2026.
As the industry prepares for future market cycles and new innovations such as UAD 3.6 modernization, lenders and valuation providers are evaluating hybrid appraisal workflows, property data collection technologies, and other strategies to mitigate business continuity interruptions and operational issues associated with appraisal turn times and appraisal fees.

Not seeing what you need?
Request a specific report or information from MtgeFi.com
Appraisal Fees Data Sources & Analysis
Appraisal Fees Order Data
Data was supplied by an Appraisal Management Software (AMS) vendor with over 75% of orders completed using direct-to-appraiser fulfillment. This data includes order level detail by lender (bank, nonbank and credit union), geography (state, county and zip code), appraisal fees (initially quoted, and final paid fees), ordering milestones (order create date, inspection date, initial upload date, and final completion date) and appraisers (individual, firm and AMCs).
Freddie Mac Appraiser Capacity
Freddie Mac publishes a monthly Appraiser Capacity report that provides data on the volume of appraisals being completed and the number of unique appraiser licenses being used to completing them.
In March 2026 this showed 30,000 active appraiser licenses being used to submit to the Uniform Collateral Data Portal (UCDP) monthly. Additionally, the data is for all appraisal report types submitted to UCDP, not just Fannie Mae URAR 1004 and Freddie Mac URAR 70 ‘traditional appraisal’ forms.